
07/29/2022
I’ve got to admit, it was strange how dead the volume was at the beginning of the week; that is, until Big Tech started reporting earnings…
And the Street apparently liked what’s been hitting the tape.
Here’s a live look at traders coming back to the office:

But there have been a few worth watching.
If you need a decent setup — on a stock that previously ran 200% — keep your eyes on Better Therapeutics, Inc. (BTTX):
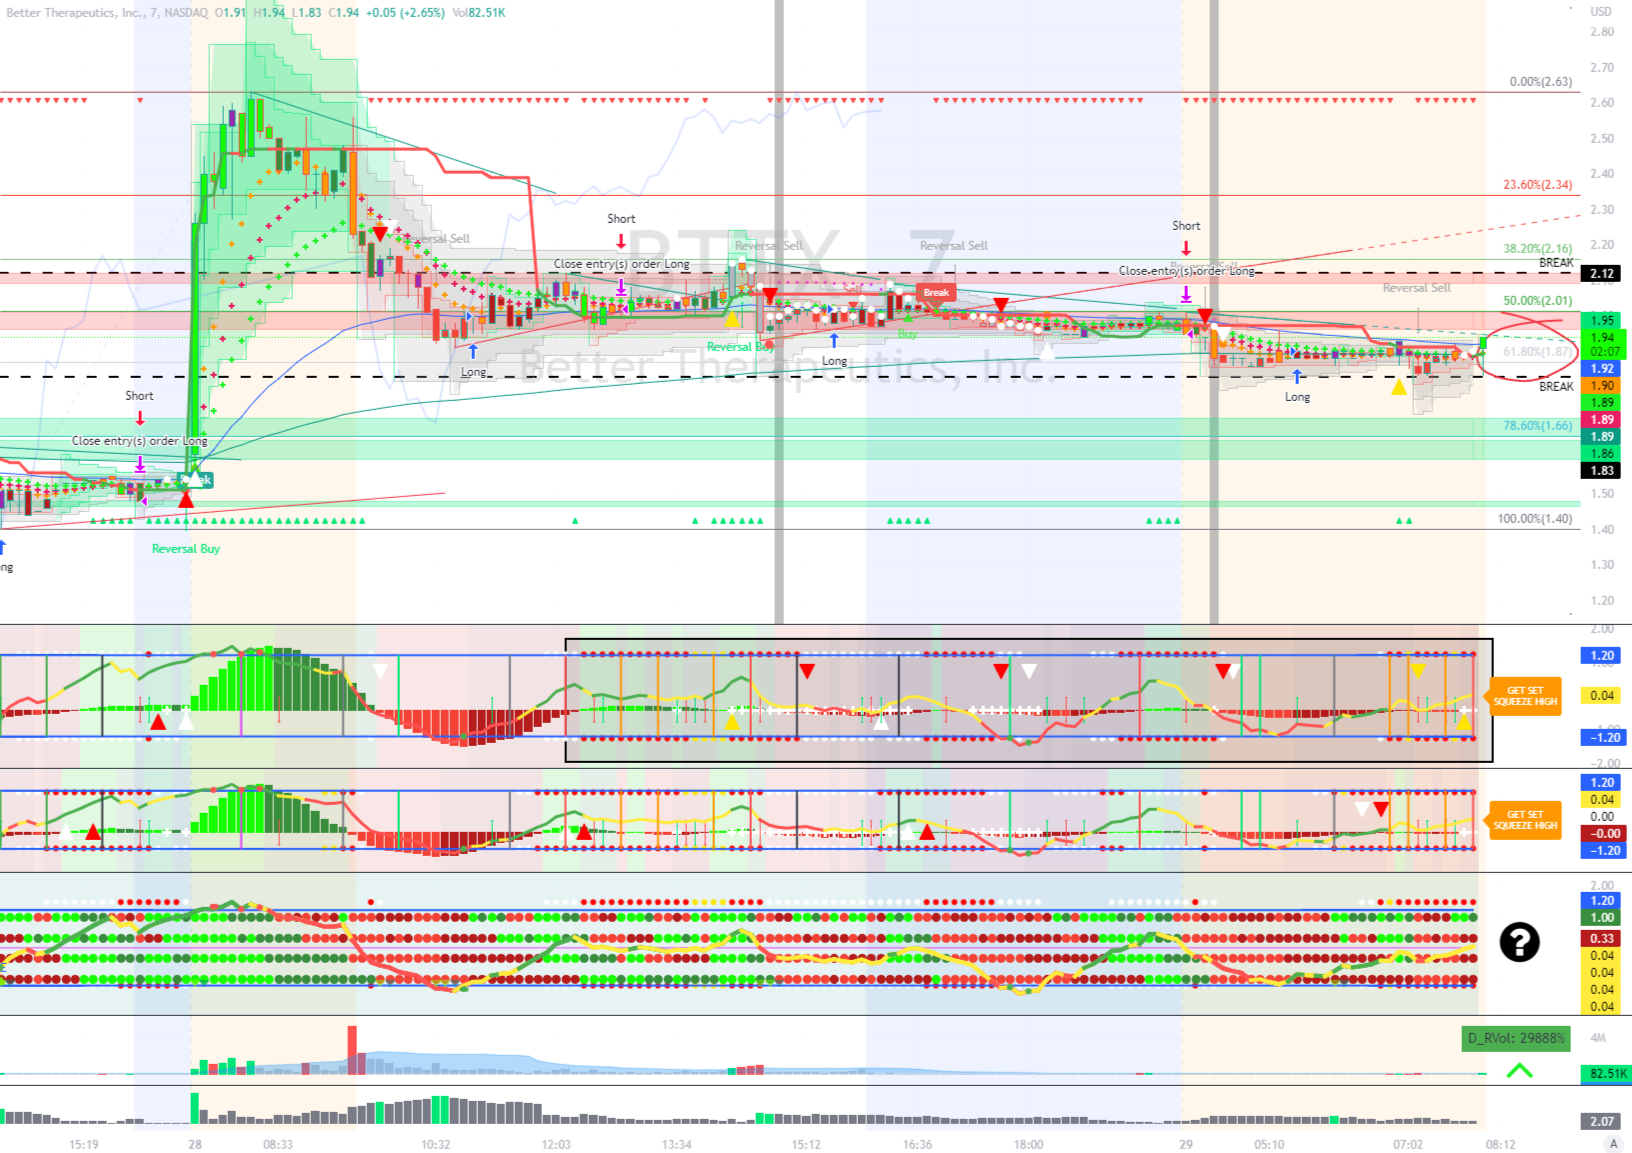
We’re looking at the 7-minute chart… Weird, right?
I like this time frame for entries on “MOMO” or, momentum stocks.
It’s fast enough to catch the price action, but slow enough to get the big picture and illustrate the entire pattern.
And that’s what we want when looking for a short term trade…
The Support and Resistance channels play a massive role in this style of trading.
When there’s a sizable jump on a small cap, you can bet there’ll be hell to pay on the way down. And with that comes new levels of Resistance as bagholders clear out at every chance they get, making Support that much more important.
After a run, sometimes you have to finagle an old saying: Better late than never early.
Okay, so what are we looking at?
BTTX is in no man’s land, stuck between two channels of Support and Resistance.
Using the Fibonacci Retracement shows us that the share price is settling in at one of my favorite spots to buy in — the “Fib Pocket” (50-61.8%).
BUT… we’re talking about a stock that jumped nearly 100% overnight, so the 78.6% level could be the ticket.
Adding to the no man’s land concept, the Squeeze Trading Tool 1.2A shows us that bulls and bears are fighting every minute, keeping the share price compressed or, “squeezed”.
I’ve highlighted this in the black box.
Still, this is a fast chart and the four dots on the Squeeze 4-Pack v8 could flip green at any moment…
You have to figure, the Volume label at the bottom of the chart shows a daily Relative Volume reading of 29,888%.
Scaling in with a small entry here and then adding at support after it breaks below ~$1.83 or above ~$2.12 makes sense to me.
The former being the accumulation game and the latter as confirmation of a breakout…
As always, set your alerts and know your risk.
Keep moving,
(Disclosure: I hold no position in BTTX but intend to initiate a position in the next 30 days.)

This material is not an offering, recommendation, or a solicitation of an offer to buy or sell the securities mentioned or discussed, and is to be used for informational purposes only. Any performance results discussed herein represent past performance, not a guarantee of future performance, and are not indicative of any specific investment. Due to the timing of information presented, investment performance may be adjusted after the publication of this report. There can be no assurance that the future performance of any specific investment, investment strategy, or product made reference to directly or indirectly in this communication will be profitable, equal any corresponding indicated historical performance levels or be suitable for your portfolio.


